
Multifamily Investment in California and Job Growth
A clear understanding of your market is essential. Our focus is multifamily properties in California.
Multifamily real estate, like all asset classes, moves through cycles. At its core, multifamily sits at the bottom of Maslow’s Hierarchy of Needs, providing essential shelter. Because of this, demand for multifamily housing is often more resilient than in other commercial real estate sectors. Residential tenants are generally more abundant than commercial tenants, which can lead to greater stability and less volatility in cash flow—especially during times of economic uncertainty.
An important driver of multifamily performance in California is job growth. As employment opportunities increase, so does demand for housing, particularly in high-growth areas. Affordability and access—especially in the workforce housing segment—are also key factors influencing the market.
Let’s review recent trends in California’s job growth, based on data from the State of California’s Employment Development Department (EDD): https://edd.ca.gov/
Statewide Employment Overview
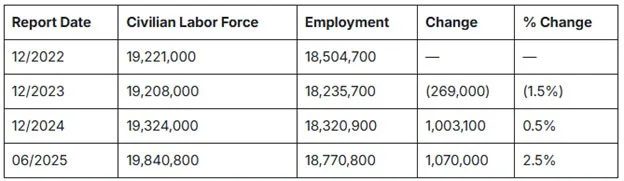
Since employment levels are seasonal, comparing June to December isn’t always meaningful. To get a clearer picture, consider June-to-June comparisons:
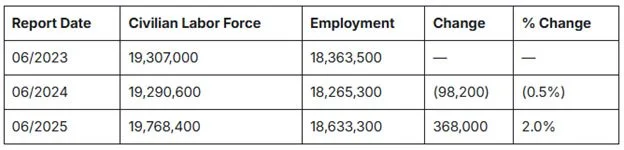
The data suggest positive momentum in job growth over the past 6 to 12 months.
County-Level Employment Growth
For investment decisions, it’s critical to analyze trends at the county level. EDD provides monthly employment data by county. Between December 2023 and December 2024, the five counties with the highest percentage increases in employment were:
· Merced: 7.61%
· Trinity: 7.44%
· Tuolumne: 6.21%
· Shasta: 5.67%
· San Joaquin: 5.36%
While these percentages are impressive, they reflect growth in smaller markets. To get a sense of the larger picture, here are the five largest counties by total employment and their respective percentage changes:
· Los Angeles: 1.70%
· Orange: -0.75%
· San Diego: -0.01%
· Riverside: 1.32%
· Santa Clara: -1.54%
Between December 2023 and December 2024, Los Angeles and Riverside counties saw employment growth, while Orange, San Diego, and Santa Clara experienced declines.
Unemployment figures are also available on the EDD website and should be considered alongside employment growth and population trends. Ideally, you want to see strong population growth, increasing employment, and declining unemployment—all at the county level—to identify the most promising markets for investment.
Data sourced from the State of California Employment Development Department: https://edd.ca.gov/